今日のボヤキ 12/20
今回はディベートで出た肯定側の意見をもとにBIの妥当性を考えていこうと思います。
1番肯定側意見として主張されたのは少子化問題の解決でした。
問題解決が自明化のように思われますが、しかし、ここには様々問題が絡み一筋縄ではいかないようです。
肯定側意見
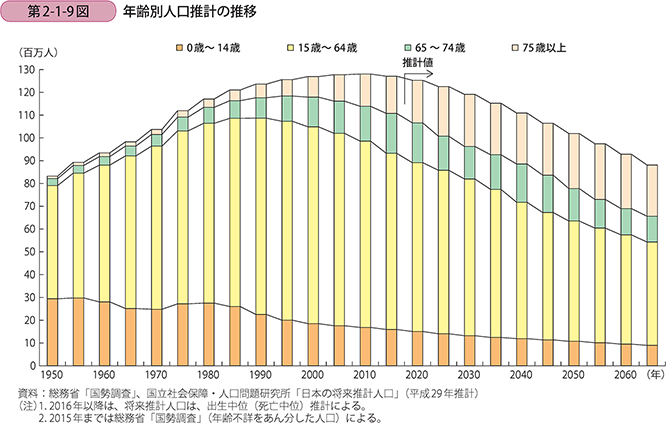
現状分析1 生産年齢人口の減少
我が国の生産年齢人口(15~64歳)は、1995年の約8,700万人をピークに減少に転じており、2015年には約7,700万人まで減少してきている(この間の減少は約1,000万人)。この傾向は将来にわたって継続すると見込まれ、2060年には約4,800万人と、2015年の約6割の水準まで減少すると推計されている。
https://www.chusho.meti.go.jp/pamflet/hakusyo/H30/h30/html/b2_1_2_1.html
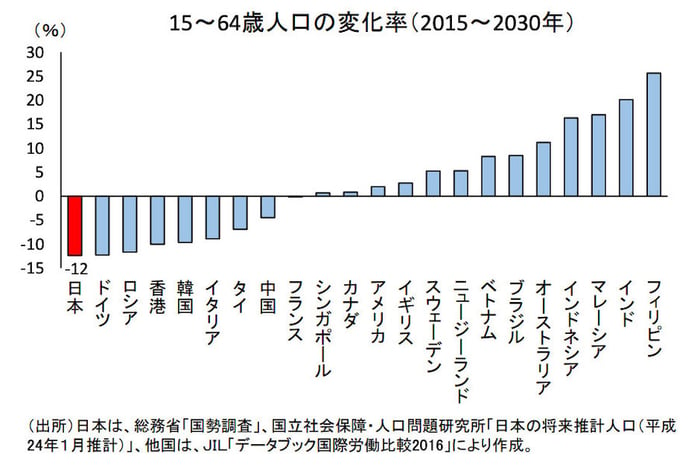
世界の生産年齢人口に目を移してみましょう。2015年〜2030年にかけての15~64歳人口の変化率を見ると、主に東アジアで減少に転じている国が多い特徴があります。中でも特に日本の減少率は-12%と高い状況にあります。
減少し続ける生産年齢人口に、企業が絶対に取り組むべき3つの施策|テレワークナビ
現状分析2 出生数の低下
グラフからも読み取れるように出生数は低下の傾向にあり、なおかつ超高齢化社会に向かっている日本の将来の不安定さが見て取れる。
https://www.mhlw.go.jp/stf/wp/hakusyo/kousei/19/backdata/01-01-01-07.html
現状分析3 子供を持たない理由
内閣府によると、「子育てや教育にお金がかかりすぎるから」が約6割と圧倒的に高く、若年層ほど割合も高い。

現状の支援策としては以下の図の通りである。

https://www8.cao.go.jp/shoushi/shoushika/meeting/promote/se_6/siryop31_p40.html
これらの現状分析より、金銭的不安は解消され、出生数は上向きになるというのが肯定側の意見です。
これに対する否定側の反論を見ていきます。
反論1 女性の出産前後の就業継続割合
「正規の職員」と「パート・派遣」に分けて就業継続の割合をみると、「正規の職員」は69.1%であるのに対し、「パート・派遣」は25.2%となっている(国立社会保障・人口問題研究所「第15回出生動向基本調査(夫婦調査)」(2015(平成27)年))。
また、末子の妊娠・出産を機に退職した女性にその理由をたずねたところ、正社員では、「家事・育児に専念するため、自発的にやめた」(30.3%)、「仕事を続けたかったが、仕事と育児の両立の難しさでやめた」(22.5%)が多くあげられている。非正社員では、「家事・育児に専念するため、自発的にやめた」(46.3%)が特に多い。
「仕事を続けたかったが、仕事と育児の両立の難しさでやめた」と回答した人にその理由をたずねると、正社員では、「勤務時間があいそうもなかった」(47.5%)が最も多く、「自分の体力がもたなそうだった」(40.0%)、「育児休業を取れそうもなかった」(35.0%)が続く。
非正社員では、「育児休業を取れそうもなかった」(41.7%)、「つわりや産後の不調など妊娠・出産にともなう体調不良のため」(35.4%)、「自分の体力がもたなそうだった」(33.3%)、「勤務時間があいそうもなかった」(33.3%)が多い。

反論2 男性の家事・育児時間の低さ

男性が子育てや家事に費やす時間をみると、2016(平成28)年における我が国の6歳未満の子供を持つ夫の家事・育児関連時間は1日当たり83分となっており、2011(平成23)年調査に比べて16分増えているものの、先進国中最低の水準にとどまっている。

上記2つの図からもわかるように、育児の負担は女性に偏る。政府としては、男女共同参画社会を推進しているようだが、この現状から子供を持ちたいと思う人は金銭面だけが解消されても大きくは増加しないだろうと考えられる。
反論3 未婚化
50歳時の未婚割合1をみると、1970年は、男性1.7%、女性3.3%であった。その後、男性は一貫して上昇する一方、女性は1990年まで横ばいであったが、以降上昇を続け、2010年国勢調査では男性20.1%、女性10.6%、2015年は男性23.4%、女性14.1%と、それぞれ上昇している。2015年の国勢調査の結果に基づいて出された推計は、これまでの未婚化、晩婚化の流れが変わらなければ、今後も50歳時の未婚割合の上昇が続くことを予測している。

反論4 晩婚化
平均初婚年齢は、長期的にみると夫、妻ともに上昇を続け、晩婚化が進行している。2018年で、夫が31.1歳、妻が29.4歳となっており、1985年と比較すると、夫は2.9歳、妻は3.9歳上昇している。前年(2017年)との比較では、男女とも横ばいとなっている。
また、出生時の母親の平均年齢を出生順位別にみると、2018年においては、第1子が30.7歳、第2子が32.7歳、第3子が33.7歳と上昇傾向が続いており、1985年と比較すると第1子では4.0歳、第2子では3.6歳、第3子では2.3歳それぞれ上昇している。

以上の4つの反論が挙げられます。
金銭で解決できる範囲もありますが、家庭や育児の問題は金銭だけでは解決しそうにありません。
また、女性の社会進出が進んだことや単身でも娯楽が増えたことにより、結婚よりも一人の自由な時間に重きを置く人が増加している傾向にあることがわかります。この人たちにBIを支給したとしても、おそらく現状から回復することはないでしょう。
よって金銭面で解決できる範囲もあるが、先進諸国と比べても環境はまだまだ途上国レベルであり、一概に少子化の解消とは言い切れないものと考えます。
皆さんはどのように考えますか?
English edition
Today's blurbs 12/20
This time, I would like to consider the validity of BI based on the affirmative opinions that came out in the debate.
The first affirmative opinion argued was the solution to the declining birthrate problem.
Although the solution to the problem seems obvious, however, it seems that it is not a simple matter as there are various problems involved.
Affirmative Opinion
Analysis of Current Situation 1: Decline in Working-age Population
Japan's working-age population (aged 15-64) peaked at about 87 million in 1995 and has been declining ever since, reaching about 77 million in 2015 (a decline of about 10 million during this period). This trend is expected to continue into the future, with the number of people estimated to decline to about 48 million in 2060, about 60% of the 2015 level.
https://www.chusho.meti.go.jp/pamflet/hakusyo/H30/h30/html/b2_1_2_1.html
Turning to the world's working-age population, the rate of change in the population aged 15-64 between 2015 and 2030 is characterized by a number of countries, mainly in East Asia, that have begun to decline. Among them, the rate of decline in Japan is particularly high at -12%.
Three measures that companies should definitely take to address the continuing decline in the working-age population|Telework Navi
Analysis of Current Situation 2: Decline in the Number of Births
As can be read from the graph, the number of births is on a downward trend, and yet we can see the instability of Japan's future as it moves toward a super-aging society.
https://www.mhlw.go.jp/stf/wp/hakusyo/kousei/19/backdata/01-01-01-07.html
Analysis of Current Situation 3 Reasons for not having children
According to the Cabinet Office, "Because it costs too much to raise and educate children" is by far the most common reason, at around 60%, and the younger the age group, the higher the percentage.
The current support measures are shown in the figure below.
https://www8.cao.go.jp/shoushi/shoushika/meeting/promote/se_6/siryop31_p40.html
From these analyses of the current situation, the positive side is that financial concerns will be resolved and the number of births will turn upward.
We will now look at the refutations of the negative side to this.
Rebuttal 1: Percentage of women who continue to work before and after childbirth
Looking at the percentage of women who continue to work separately as "regular employees" and "part-time/temporary staff," 69.1% of "regular employees" continue to work, while 25.2% of "part-time/temporary staff" continue to work (National Institute of Population and Social Security Research, "15th Basic Survey on Birth Trends (Couple Survey)" (2015 (Heisei 27)).
When women who left their jobs after the pregnancy or birth of their youngest child were asked about the reasons for leaving, the most common reasons given by full-time employees were "voluntarily quit in order to focus on housework and childcare" (30.3%) and "wanted to continue working but quit due to difficulties in balancing work and childcare" (22.5%). Among non-full-time employees, "Quitted voluntarily to concentrate on housework/child care" (46.3%) was particularly common.
When those who answered "wanted to continue working but quit because of the difficulty of balancing work and childcare" were asked the reason, the most common response among full-time employees was "work hours were not suitable" (47.5%), followed by "I didn't think I would be physically strong enough" (40.0%) and "I didn't think I could take childcare leave" (35.0%). (35.0%) followed.
For non-full-time employees, the most common reasons given were "was unlikely to take childcare leave" (41.7%), "due to physical problems associated with pregnancy and childbirth such as morning sickness and postpartum illness" (35.4%), "was unlikely to be physically strong enough" (33.3%), and "was unlikely to work the right hours" (33.3%).
Response 2: Men spend less time on housework and childcare
Looking at the time men spend on child-rearing and housework, the time related to housework and childcare for husbands with children under 6 years old in Japan in 2016 (2016) was 83 minutes per day, an increase of 16 minutes from the 2011 survey, but still the lowest level among developed countries.
As can be seen from the above two figures, the burden of childcare is disproportionately placed on women. Although the government seems to be promoting a gender-equal society, this current situation suggests that the number of people who want to have children will not increase significantly even if only the financial aspect is resolved.
Response 3: Unmarried
Looking at the percentage of unmarried persons1 at age 50, in 1970, the figures were 1.7% for men and 3.3% for women. Since then, the percentage of men has consistently increased, while the percentage of women remained flat until 1990, but has continued to rise since then, reaching 20.1% for men and 10.6% for women in the 2010 census, and 23.4% for men and 14.1% for women in 2015. estimates predict that the percentage of unmarried people at age 50 will continue to rise in the future if the previous trend of unmarried and late marriages remains unchanged.
Response 4: Late marriages
The average age at first marriage has continued to rise over time for both husbands and wives, and the trend toward later marriage has continued: in 2018, the average age at first marriage was 31.1 years for husbands and 29.4 years for wives, an increase of 2.9 years for husbands and 3.9 years for wives compared to 1985. Compared to the previous year (2017), both men and women remained unchanged.
In addition, the average age of the mother at birth, by birth order, continued to rise in 2018: 30.7 years for the first child, 32.7 years for the second child, and 33.7 years for the third child; compared to 1985, it increased by 4.0 years for the first child, 3.6 years for the second child, and 2.3 years for the third child, respectively.
These are the four counter-arguments.
While money can solve some of the problems to some extent, money alone is unlikely to solve the problems of family and childcare.
In addition, we can see that the number of people who value their free time alone more than marriage is on the rise, due to the increasing number of women entering the workforce and the increase in recreational activities even for single people. Even if we provide BI to these people, they will probably never recover from their current situation.
Therefore, although there are some areas that can be solved financially, the environment is still at the level of developing countries compared to developed countries, and we believe that this cannot be said to be a general solution to the declining birthrate.
What do you all think?